Facies/Rock Properties Variogram View
The Facies Variogram View is opened when you open either the Experimental Variogram form (modeling > Facies > Experimental Variogram), or the Variogram Model form (modeling > Facies > Variogram Model). The Facies Variogram View is a dedicated view; it will close when you close the form that opened the view.
The Rock Properties Variogram View is opened when you open either the Experimental Variogram form (modeling > Rock Properties > Experimental Variogram), or the Variogram Model form (modeling > Rock Properties > Variogram Model). The Rock Properties Variogram View is a dedicated view; it will close when you close the form that opened the view.
Displaying data
You can visualize the experimental variogram (data points) in the Variogram View by entering the Scanning Directions and Parameter Settings on the Experimental Variogram form. To visualize the variogram model (curve), use the Variogram Model form. Note that only data points located within the currently selected VOI and facies are used to build the experimental variogram(s). In the View itself there are various controls on how to display the data.
- Maximizing a single chart - Click on the pop out icon
 to maximize the size of the selected chart. To return to the original size, click on the pop in icon
  .
. - Changing format and units - A right mouse button click on the horizontal or vertical axis opens a context menu. You can change the units and the format by making a selection from the options provided to you.
- Zooming - In the plot area, left mouse button click and keep pressed down to activate zooming. You can move your mouse in any direction. A preview window indicates the new display window. When you let go of the left mouse button, this is the part of the chart that is shown. To zoom out, double click in the chart area.
- Zooming along axes -
- Scroll axis relative to other axis - Hover over the center of the vertical or horizontal axis with your mouse until the tool tip changes into a bidirectional arrow. Left mouse button click and keep pressed down while moving the mouse will scroll the selected axis relative to the other axis.
- Scale Settings - Available for all charts. In the plot area, right mouse button click to open the context menu. Select the Scale Settings option to open the Scale Settings dialog box and enter the preferred minimum and maximum data for X-axis and Y-axis.
- Show/hide legend -
A right mouse button click in the view opens a context menu with the Show/hide legend option. When the legend is shown, you can also use it as a display filter: when you click on a name, that data is hidden from the chart, and the legend is grayed out.
Any chart view has a dedicated toolbar at the right side. You can open and close this toolbar using the little arrow.
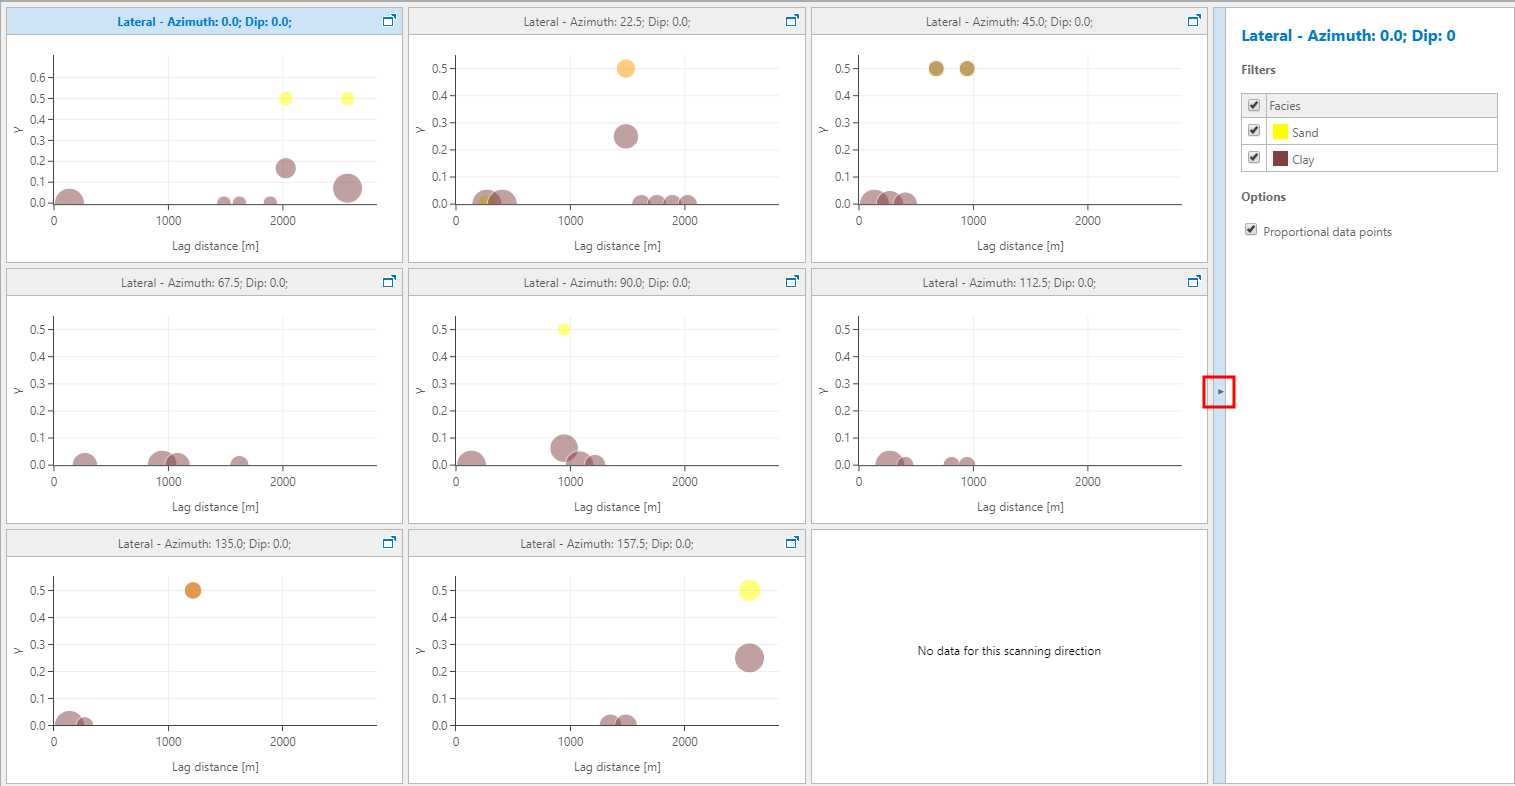
Show or hide the variogram toolbar click to enlarge
- Displaying data points - For each facies that you want to visualize, check the checkbox in the toolbar on the right side of the view. The selection you make here is applied to all the displayed variograms in the view.
One or more variograms are displayed, depending on the number of directions you have chosen for analyzing your variogram(s). Data points in the chart(s) indicate the experimental variogram, i.e. the semi-variance of each lag. The black curve is the so called variogram model, which is auto-fitted through the experimental variogram values.
Changes to any of the calculation parameters that you make on the Experimental Variogram form are reflected in the Variogram View after you click Apply. Changes on the Variogram Model form are reflected in the Variogram View immediately.